When it comes to business process mapping and improvement, two popular tools often come into play: Brown Paper and Flow Charts. Each of these methodologies serves a unique purpose in visualizing processes, identifying bottlenecks, and streamlining operations. However, they are used in different contexts and bring different advantages to the table. This article will compare Brown Paper and Flow Charts, helping you understand their strengths, limitations, and ideal use cases.
1. What is a Brown Paper Exercise?
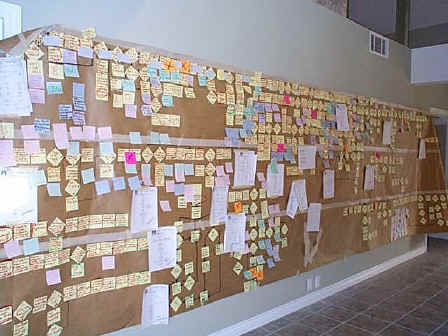
A Brown Paper exercise is a collaborative, hands-on approach to process mapping that involves physically creating a large visual representation of a business process on a brown paper roll or large sheet. This tool is often used in workshops, where participants actively contribute by adding notes, diagrams, and symbols to represent different steps in a process.
Key Characteristics:
- Collaborative: Brown Paper exercises typically involve multiple stakeholders, encouraging team involvement and discussion.
- Visual: The large, often wall-sized paper allows for a comprehensive, easy-to-understand view of the entire process.
- Dynamic: Because the elements are often physically movable (e.g., sticky notes), the Brown Paper can be easily modified as the team iterates on the process.
Advantages:
- Engagement: The interactive nature of the exercise fosters team collaboration and buy-in.
- Clarity: It provides a holistic view of the process, making it easier to identify bottlenecks and inefficiencies.
- Flexibility: The process map can be quickly adapted and changed as discussions progress.
Limitations:
- Scalability: It’s challenging to use this method for very complex processes or for processes that require frequent updates.
- Documentation: Brown Paper exercises often lack the precision needed for formal documentation or digital archiving.
2. What is a Flow Chart?
A Flow Chart is a more traditional and formalized method for representing processes. It uses standardized symbols like rectangles, diamonds, and arrows to depict different steps, decisions, and flows within a process. Flow Charts are typically created using software tools like Microsoft Visio, Lucidchart, or even PowerPoint.
Key Characteristics:
- Structured: Flow Charts follow a strict syntax and use standardized symbols, making them easy to interpret.
- Precise: The method allows for detailed, precise mapping of processes.
- Scalable: Flow Charts can be as simple or as complex as needed, making them suitable for both simple processes and large, intricate systems.
Advantages:
- Formal Documentation: Flow Charts are excellent for creating formal process documentation that can be easily shared and stored.
- Clarity and Precision: The structured nature of Flow Charts makes them ideal for clear, unambiguous communication of processes.
- Scalability and Flexibility: They can accommodate very detailed and complex processes.
Limitations:
- Less Collaborative: Flow Chart creation is often less collaborative than Brown Paper exercises, which can lead to less stakeholder engagement.
- Complexity: For very large or complex processes, Flow Charts can become overly intricate and difficult to follow.
3. Comparative Analysis: Brown Paper vs. Flow Chart
| Feature | Brown Paper | Flow Chart |
|---|---|---|
| Collaboration | Highly collaborative, encourages team input | Typically created by a smaller group or individual |
| Visualization | Large, physical, dynamic representation | Digital, formal, and structured representation |
| Adaptability | Easy to modify during discussions | Modifications require software and may be less intuitive |
| Detail Level | High-level overview, less precise | Can capture detailed, step-by-step processes |
| Best Use Cases | Workshops, initial brainstorming, identifying bottlenecks | Formal documentation, process standardization, complex processes |
4. Which One Should You Use?
The choice between Brown Paper and Flow Chart depends largely on your specific needs and the stage of process mapping you are in.
- Use a Brown Paper Exercise if you’re in the early stages of process mapping, need to encourage team collaboration, or want to visually explore and brainstorm a process.
- Use a Flow Chart if you need to document a process formally, require a high level of detail and precision, or are dealing with a complex system that needs to be clearly communicated.
Conclusion
Both Brown Paper exercises and Flow Charts are valuable tools in process mapping and improvement, each with its unique strengths. By understanding the differences and best use cases for each, you can choose the most appropriate method for your specific business needs. Whether you prioritize collaboration or precision, there’s a tool that fits your approach to process mapping.
